I've got an alternate option: using the social media aspect to scour the performance value of contestants. But I'll also have something that WNTS doesn't have: a buzz meter. The social media aspect also presents an international flavor to the rankings, since it's just not centralized to America; this might make it different from WNTS, which tends to update their rankings East Coast first, then West Coast. Obviously, there's a ton of factors for what goes into the social media rating: the song being sung terribly is obviously one, but boring songs, the song being sung less well than the original, are all reasons for low(er) rankings. Higher rankings may involve creativity, good singing/emotion, good song selection, etc. The buzz meter shows who is really raking in the views. Let's note that I've consolidated each ranking for each particular night and used a Gaussian normalization to equalize the values between 0-100, much like what WNTS does. The performance ratings are somewhat similar, but also have some key differences. Take a look for yourself.
So far, I've done everything this season. Here's what I have:
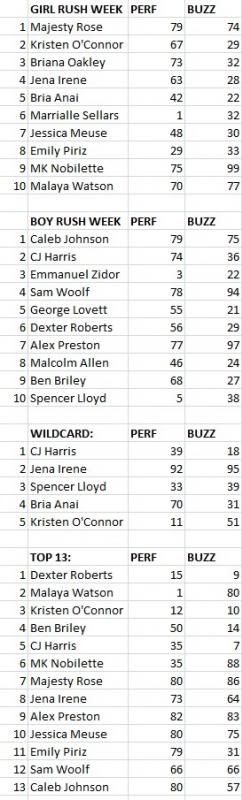
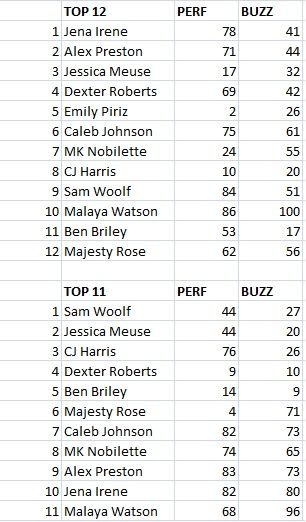
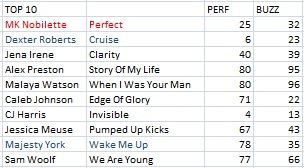
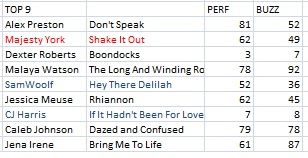
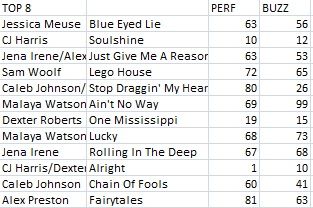
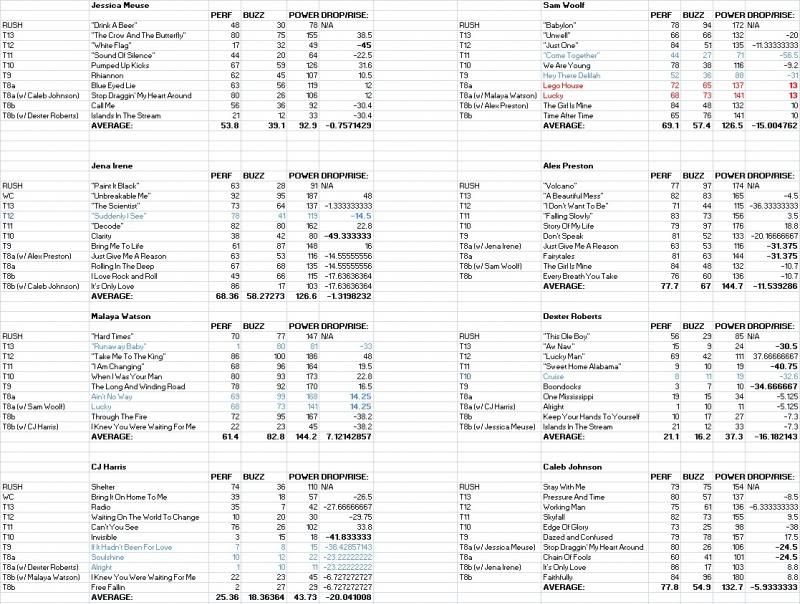
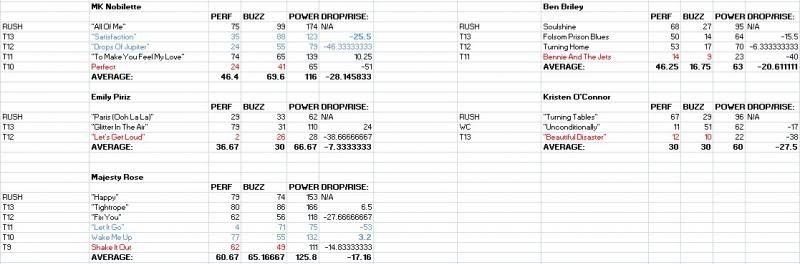
And then, for each of the individual contestants:
These numbers are just food for thought. We always need a mathematical approach to this, but it comes out fairly accurate. I'll keep updating this thread for more numbers with ensuing weeks.
-----------------------------------------------------------------------------------------------------------------------------
UPDATES:
Added a couple of new things: the power metric, which combines the performance and buzz score, so we can get a singular, consolidate ranking of each contestant in a vacuum. But perhaps more importantly, the rise/drop metric: which shows how well the contestants have done with power score relative to their average power score up to that week. So you know...you can predict which contestants should have been in the bottom three, but weren't in there; or which contestants should not have been there but were in there.
Dexter Roberts should have been in the bottom three 3 other times, but wasn't, for instance.
Another thing? It measures contestant's momentum. By calculating the contestants' average drop/rise score, we see who is actually improving week to week, or who is slacking off and losing power in their performances. Without further ado, up to the top 8b, here's what we have:
1) Malaya Watson 7.12
2) Jessica Meuse -0.76
3) Jena Irene -1.32
4) Caleb Johnson -5.93
5) Alex Preston -11.54
6) Sam Woolf -15.00
7) Dexter Roberts -16.18
8) CJ Harris -20.04
This jibes well with the general feeling: the guys have all peaked, and are yielding diminishing returns on power scores with each passing week. Caleb represents best, but even he is yielding lower scores each time. Only Malaya is really improving (over 7x as much as the next contestant), but Jessica and Jena are both close to breaking even (as seen in the scores above, Jena is using buzz to build up her power score, while Jessica is staying level with her performance scores, more or less).
My impression is that for a particular week, contestants base their votes on the rise/drops of the contestants for a particular week. This doesn't always work, so it's a crapshoot. As mentioned, Dexter survived this three times. But still, that would indicate that Malaya, Jessica and Jena are in trouble (in that order), with Malaya being eliminated.
And this also gets rid of the huge fudge factor in Malaya performances by her fans, since it's relative to her other performances.
No comments:
Post a Comment